In our last section on moving averages, we had an opportunity to learn a bit about the simple moving average. There are also other types of moving averages as well. Two of the most commonly used are the “weighted moving average” and the “exponential moving average”. The “weighted moving average” is abbreviated as “WMA” and the “exponential moving average” is abbreviated as “EMA”. The “exponential moving average” is also known as the “exponentially weighted moving average” abbreviated as “EWMA”.
The “weighted moving average” and the “exponential moving average” are both considered to be weighted moving averages. The reason for this is that both the weighted moving average and the exponential moving average apply weighting factors to each of the prices used to calculate the average. Basically, they give more “weight” or value to the most recent prices. The simple moving average, on the other hand, gives equal weight or value to all prices used to calculate the average. In a weighted moving average, the weighting for each older price decreases arithmetically, whereas in an exponential moving average, the weighting for each older price decreases exponentially… hence its name.
| Date | Open | High | Low | Close | Avg | Weight | Weight x Close |
| 7/15/2015 | 1.10086 | 1.10348 | 1.09291 | 1.09463 | 1.10480 | 1 | 1.09463 |
| 7/16/2015 | 1.09468 | 1.09619 | 1.08548 | 1.08741 | 1.10272 | 2 | 2.17482 |
| 7/17/2015 | 1.08751 | 1.09060 | 1.08276 | 1.08296 | 1.09995 | 3 | 3.24888 |
| 7/20/2015 | 1.08336 | 1.08694 | 1.08077 | 1.08244 | 1.09765 | 4 | 4.32976 |
| 7/21/2015 | 1.08213 | 1.09683 | 1.08110 | 1.09366 | 1.09691 | 5 | 5.46830 |
| 7/22/2015 | 1.09356 | 1.09660 | 1.08686 | 1.09280 | 1.09543 | 6 | 6.55680 |
| 7/23/2015 | 1.09261 | 1.10173 | 1.09208 | 1.09833 | 1.09490 | 7 | 7.68831 |
| 7/24/2015 | 1.09831 | 1.09950 | 1.09244 | 1.09758 | 1.09311 | 8 | 8.78064 |
| 7/27/2015 | 1.09814 | 1.11287 | 1.09681 | 1.10872 | 1.09393 | 9 | 9.97848 |
| 7/28/2015 | 1.10911 | 1.10987 | 1.10214 | 1.10594 | 1.09445 | 10 | 11.0594 |
Table 1.2
In Table 1.2 we can see the “Weight” column to the right of the “Close” column. As you can see, the most recent closing price of 1.10594 has a weight assigned to it of “10”. In contrast, the first closing price has the smallest weight of “1” assigned to it. The weights assigned to each of the closing prices were created strictly for the purpose of illustration.
To calculate our moving average we will use the following:
Sum of Weights = 1+2+3+4+5+6+7+8+9+10 = 55
Sum of Weights x Close = 1.09463+2.17482+3.24888+4.32976+5.46830+6.55680+7.68831+8.78064+9.97848+11.0594 = 60.38002
Weighted Moving Average (WMA) = (Sum of Weights x Close) / Sum of Weights
Weighted Moving Average (WMA) = 60.38002/55 = 1.09782
Exponential Moving Average (EMA) = EMAtoday = EMAtoday-1 + (k*(Pricetoday – EMAtoday-1))
EMAtoday-1 = yesterday’s EMA
Price = today’s closing price
k is the exponential smoothing factor
k = 2 / (n + 1) where n is equal to the number of days used to calculate the EMA.
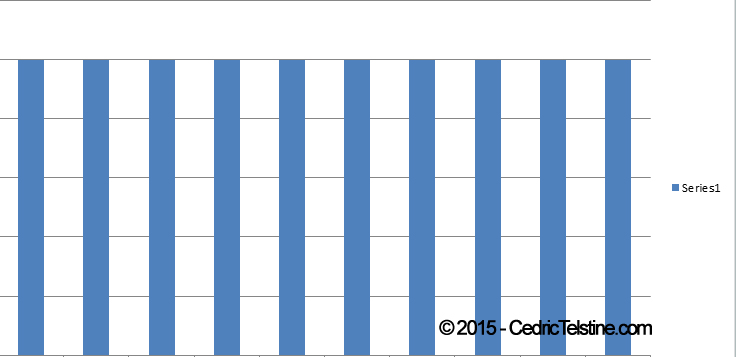
Figure 1.3
Figure 1.3 shows us an example of the weights of the last 10 closing prices for a SMA. From left to right the weights of the closing prices are shown from oldest to newest. As you can see, all of the closing prices are given equal weight.
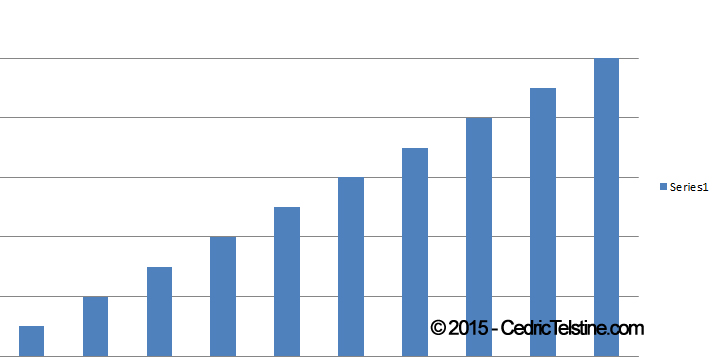
Figure 1.4
Figure 1.4 shows us an example of the weights of the last 10 closing prices for a WMA. From left to right the weights of the closing prices are shown from oldest to newest. As you can see, the most recent closing prices are given more weight than the closing prices in the past.
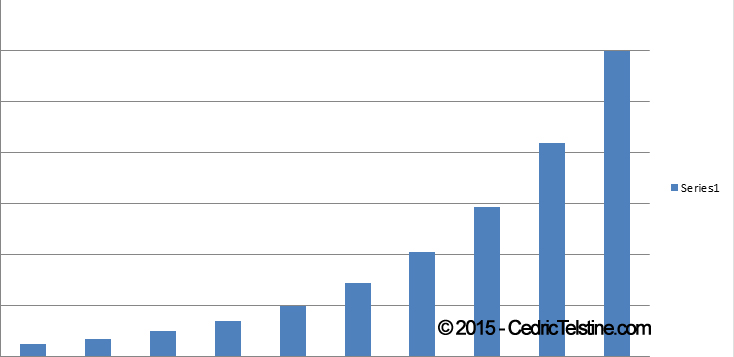
Figure 1.5
Figure 1.5 shows us an example of the weights of the last 10 closing prices for an EMA. From left to right the weights of the closing prices are shown from oldest to newest. As you can see, the most recent closing prices are given more weight than the closing prices in the past.
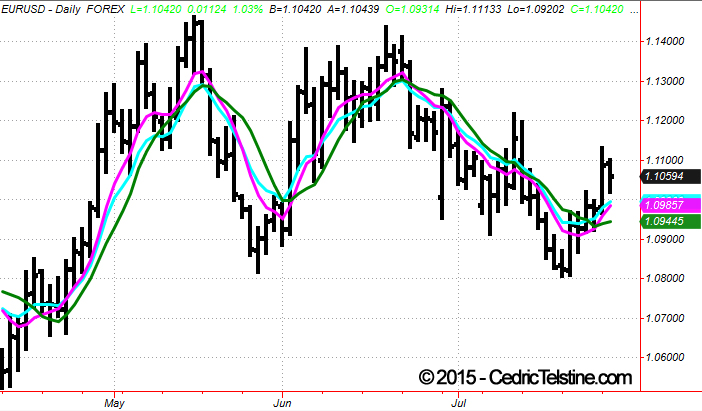
Figure 1.6
Figure 1.6 shows us the three types of moving averages we have discussed. The green line on our daily EURUSD chart is our 10-day simple moving average. The magenta line on our daily EURUSD chart is our 10-day simple moving average. The light-blue line on our daily EURUSD chart is our 10-day simple moving average.
Leave a Reply