
Figure 1.2
In our previous sections of our introduction to moving averages, we have had an opportunity to explore some of the basics of moving averages. In this section we are going to delve a bit deeper into moving averages.
Moving averages are not just used in financial market technical analysis, but used in quite a number of other disciplines such as economics, engineering, statistics, etc. Moving averages as used to “smooth” data to make it easier to visualize underlying trends.
In Figure 1.2 above, we can see the daily bar chart of the EURUSD currency pair. We can also see the 10-day SMA (green line). The SMA is clearly smoother than the zigs and zags of the price bars. The SMA makes it simpler for us to visualize the short-term uptrends and downtrends in the chart in Figure 1.2.
While we can see that the SMA helps us to more easily visualize the trend, how do we go about using it to trade? Typically, when prices move above the SMA the market is said to be in an uptrend. Conversely, when prices fall below the SMA the market is said to be in a downtrend. Let’s create a simple SMA trading system based on the typical interpretations just mentioned above.
First, we will create a simple rule to signal when to buy (go long) the EURUSD.
We could simply buy the EURUSD when the price rises above our SMA. If we are trading in real time we would need to be alerted when the price rises above the 10-day SMA. To keep things simple, we will require that the EURUSD closes above the 10-day SMA to trigger a trade. Rather than entering the trade on the close we will enter our trade at the next opening price of the EURUSD.
Here is the first rule of our 10-day SMA trading system:
Buy Rule: When the EURUSD closes above the 10-day SMA we will buy (go long) the EURUSD at the next open
Then we will create a simple rule to signal when to sell (go short/sell short) the EURUSD.
Here is the second rule of our 10-day SMA trading system:
Sell Rule: When the EURUSD closes below the 10-day SMA we will sell short (go short) the EURUSD at the next open
Now we have a basic 10-day SMA trading system. Here’s a chart showing us the trades for our simple system thus far.

Figure 1.7
Figure 1.7 shows us some of the trades for our 10-day SMA. The blue up arrows point to the bars where we bought on the open. The red down arrows point to the bars where we sold on the open. Let’s take a closer look at our trades.
You will also notice the “Buy 100000” below our buy trades and the “Sell -100000” above our sell trades. “Buy 100000” indicates that we are buying 1 standard lot of the EURUSD. “Sell -100000” indicates that we are selling 1 standard lot of the EURUSD.
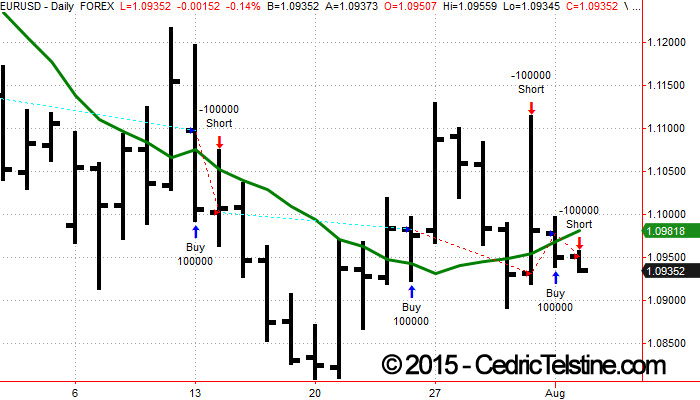
Figure 1.8
In Figure 1.8 shows us our daily EURUSD chart with a closer look at our last 5 trades. The light-blue dashed lines show us the progress of our winning trades and the red dashed lines show us the progress of losing trades.
From the chart above, we can see that the trades are being taken as specified by our 10-day SMA system. Verifying that your system is taking the trades when and where it should take them is a vitally important step in creating any trading system. In Figure 1.8 we can see that each trade was taken at the next open after a previous close above or below the 10-day SMA.
Please keep in mind that the 10-day SMA was chosen for the purpose of simplicity and illustration only. With that in mind, how did our system perform?
10-day SMA system
Total Net Profit = $9,214.41
Trading Period = 12/28/2009 – 8/3/2015
As we can see, our system showed a positive total net profit. Is that it? Is that all there is to create a winning trading system… just pick any SMA and start trading profitably? The answer is no. There is more to creating a profitable than choosing a random SMA. Wouldn’t it make sense to see how well an SMA system would perform with an SMA other than 10? Of course it would. Let’s explore some other possibilities.
The number “10” in our 10-day SMA is referred to as the “length” of the SMA. This “length” can be varied to any other SMA we would like to test. Let’s say that we wanted to vary the length of our SMA from 1 to 100 to see if we can improve our total net profit. This process of varying a trading system’s parameters to find better performance is known as “optimization”. Because this optimization is being performed on historical data it is also referred to as “backtesting”.
An optimization has been performed and here is the best result in terms of total net profit.
27-day SMA system
Total Net Profit = $32.855.20
Trading Period = 12/28/2009 – 8/3/2015
We can see that our 27-day SMA system outperformed our 10-day SMA system in terms of total net profit. The total net profit from our 27-day SMA system was over 3 times that of our 10-day SMA system. Let’s take a look at some of the most recent trades for the 27-day SMA system.

Figure 1.9
In Figure 1.9 we can see the most recent trades of the 27-day SMA system as well as the 27-day SMA (green line).
Before we continue, let’s cover a few important points about the two SMA trading systems we have had a chance to look at.
1 – No risk control was included in trading systems. For the purpose of simplicity we looked at the basic, raw SMA systems themselves.
2 – Both systems are “stop and reverse” systems. This means that when one trade ends another trade immediately begins in the opposite direction. When a buy trade ends a new sell trade begins and when a sell trade ends a new buy trade begins. This type of trading system never, “stand aside” as it is always in the market.
Next, we will explore some simple trading systems using some of the other types of moving averages we have previously discussed.
Leave a Reply